
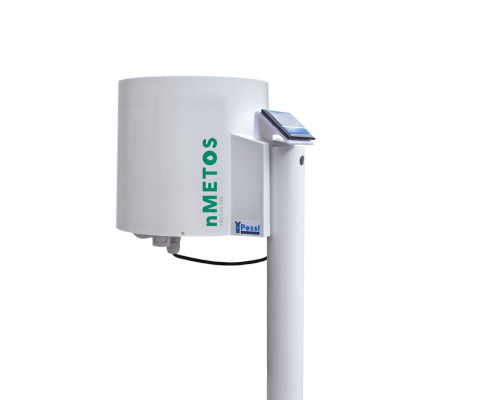
nMETOS
The most essential sensor set for your fields. Affordable, compact & simple precision farming equipment built for the North American climate.
Real-Time Insights
nMETOS makes use of modern communication infrastructures for optimal work planning and disease management decisions on your farm. Your nMETOS device comes pre-configured and tested to connect to a low-cost NBIoT network so you get quick access to highly reliable localized forecasts, in-field precipitation, relative humidity, leaf wetness and temperature data.
Use this data to monitor ideal spray weather, drive your work plans and fine-tune water management. With nMETOS monitoring your fields remotely, key information is easily accessible through your mobile and desktop devices when you need it most.
Add other FieldClimate software options to expand knowledge of potential disease risks, soil conditions and more.
EASY TO SET UP & CONNECT
nMETOS can be installed in minutes and easily connects to an existing NB IoT network. With additional METOS Subscriptions, you can get extra features, including disease models for over 40 different crops.
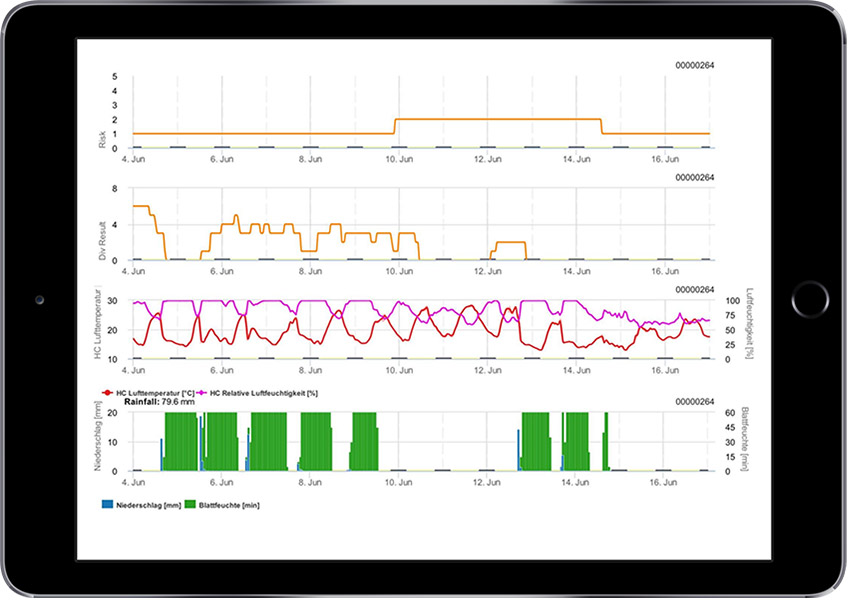
C. beticola disease risk model
This simple risk model is used to evaluate, if C. beticola could be expected at all. If the incubation period could be fulfilled within the last 2 weeks, a value of 1 of incubation is shown, if not, the value is 0. Besides this model also a model for sporulation is shown. For sporulation, optimal conditions of 48 hours of high relative humidity with an average temperature of 30°C are used. For the interpretation of data: The risk is 0 if the incubation period has been longer than 2 weeks. If this is not the case, the model output will be 1. If there is a sporulation model result of higher than 10% calculated within the last week, the risk will be shown to be 2 and if the sporulation result is higher than 30% the risk output will be 3.
KEY BENEFITS
Plan your irrigation by monitoring crop evapotranspiration results for more effective irrigation planning, which saves water, money and time.
Access to crop/disease models helps to improve plant protection and prevent crop losses.
Predictive data allows you to plan your spray program based on disease models, and also check the quality of your spray work online.
Monitoring climatic conditions is important to help prevent animal health issues that can occur in barns without standard climate conditions.
Save time and increase your operation’s efficiency by incorporating work planning on the farm. Plan your work week based on a localized weather forecast for your operation.
PRODUCT VARIATIONS
| nMETOS 80 | nMETOS 80SM | nMETOS 100 | nMETOS 180 | nMETOS 180SM | nMETOS 200 | |
|---|---|---|---|---|---|---|
|
Precipitation |
✖ |
✖ |
✔ |
✔ |
✔ |
✔ |
|
Air Tempeature |
✔ |
✔ |
✖ |
✔ |
✔ |
✔ |
|
Relative Humidity |
✔ |
✔ |
✖ |
✔ |
✔ |
✔ |
|
Volumetric Water Content |
✖ |
✔ |
✖ |
✖ |
✔ |
✖ |
|
Soil Temperature |
✖ |
✔ |
✖ |
✖ |
✔ |
✖ |
|
Soil water tension |
✖ |
✔ |
✖ |
✖ |
✔ |
✖ |
|
Leaf wetness |
✖ |
✖ |
✖ |
calculated |
calculated |
✔ |
|
Dew Point |
calculated |
calculated |
✖ |
calculated |
calculated |
calculated |
|
VPD |
calculated |
calculated |
✖ |
calculated |
calculated |
calculated |
|
Delta T |
calculated |
calculated |
✖ |
calculated |
calculated |
calculated |
TECHNICAL SPECIFICATIONS
| FEATURE | VALUE |
|---|---|
|
Housing |
UV resistant polycarbonate plastic (Protection class IP65) |
|
Dimensions |
22.5 cm L x 17 cm W x 18 cm H |
|
Weight |
1,10 kg |
|
Connectivity |
NB-IoT NB1 / Cat-M1 |
|
Power supply |
3.6V high capacity primary battery* with supercap and solar panel |
|
Measuring interval |
5 minutes |
|
Logging interval |
15 minutes |
|
Communication interval |
60 minutes |
|
SENSORS |
|
|
Rain Gauge |
Sensitivity: 1 tip per 0.2 mm |
|
Air temperature |
Operating temperature range: -40 °C to +125 °C |
|
Relative humidity |
Precision 0 – 80 %: +/- 2 % |
*Battery is not included and needs to be ordered separately.
Measurement, logging and transmission intervals can be set differently to fit the client’s needs.
- Measurement interval: occurrence, when the station measures the attached sensors
- Logging interval: occurrence, when the station calculates the minimum, maximum and average values of all measurements which happened in this logging interval
- Transmission interval: occurrence, when the station transmits the stored data from the logging interval to the FieldClimate.
Interested in nMETOS?
Fill in the form and we will email you more information.